
 In server administration, it is very important to understand how the running processes work in detail, from high load to slow response time processes. When your server becomes so slow or fails to respond, you should understand the process management or Linux process management in specific to an action. When it is the time to kill a process or renice it and how to monitor the currently running processes and how these processes affect the system load. Let’s see how Linux process management will help us tune the system.
Process Types
Before we start talking about Linux process management, we should review process types. There are four common types of processes:
- Parent process
- Child process
- Orphan Process
- Daemon Process
- Zombie Process
Parent process is a process which runs the fork() system call. All processes except process 0 have one parent process.
Child process is created by a parent process.
Orphan Process it continues running while its parent process has terminated or finished.
Daemon Process is always created from a child process and then exit.
Zombie Process exists in the process table although it is terminated.
The orphan process is a process that still executing and its parent process has died while orphan processes do not become zombie processes.
Memory Management
In server administration, memory management is one of your responsibility that you should care about as a system administrator.
One of most used commands in Linux process management is the free command:
$ free –m
The -m option to show values in megabytes.
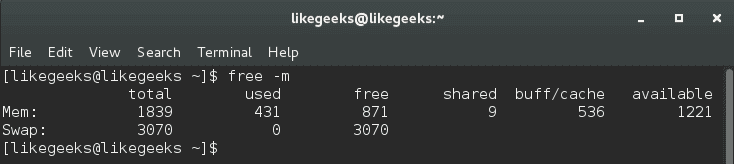
Our main concern in buff/cache.
The output of free command here means 536 megabytes is used while 1221 megabytes is available.
The second line is the swap. Swapping occurs when memory becomes to be crowded.
The first value is the total swap size which is 3070 megabytes.
The second value is the used swap which is 0.
The third value is the available swap for usage which is 3070.
From the above results, you can say that memory status is good since no swap is used, so while we are talking about the swap, let’s discover what proc directory provides us about the swap.
$ cat /proc/swaps
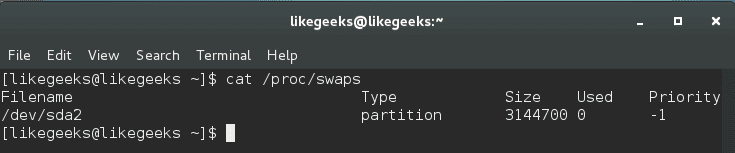
This command shows the swap size and how much is used:
$ cat /proc/sys/vm/swappiness
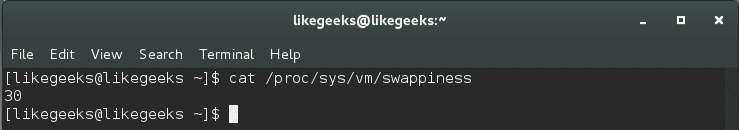
This command shows a value from 0 to 100, this value means the system will use the swap if the memory becomes 70% used.
Notice: the default value for most distros for this value is between 30 and 60, you can modify it like this:
$ echo 50 > /proc/sys/vm/swappiness
Or using sysctl command like this:
$ sudo sysctl -w vm.swappiness=50
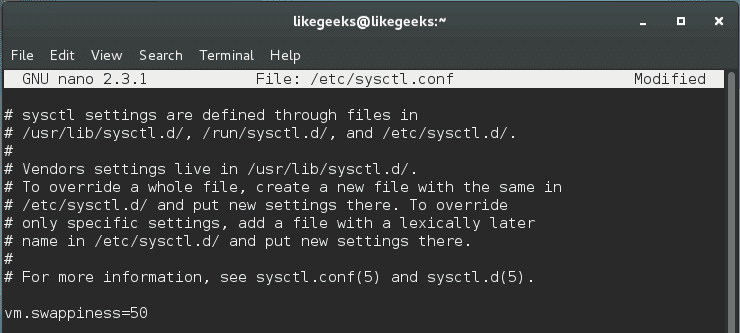
Changing the swappiness value using the above commands is not permanent, you have to write it on /etc/sysctl.conf file like this:
$ nano /etc/sysctl.conf
vm.swappiness=50
Cool!!
The swap level measures the chance to transfer a process from the memory to the swap.
Choosing the accurate swappiness value for your system requires some experimentation to choose the best value for your server.
Managing virtual memory with vmstat
Another important command used in Linux process management which is vmstat. vmstat command gives a summary reporting about memory, processes, and paging.
$ vmstat -a
-a option is used to get all active and inactive processes.
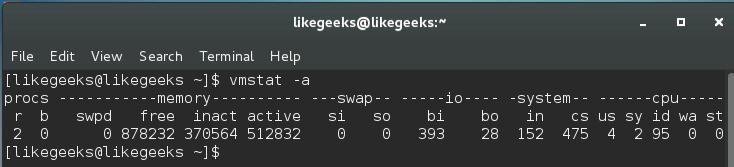
And this is the important column outputs from this command:
si: How much swapped in from disk.
so: How much swapped out to disk.
bi: How much sent to block devices.
bo: How much obtained from block devices.
us: The user time.
sy: The system time.
id: The idle time.
Our main concern is the (si) and (so) columns, where (si) column shows page-ins while (so) column provides page-outs.
A better way to look at these values is by viewing the output with a delay option like this:
$ vmstat 2 5
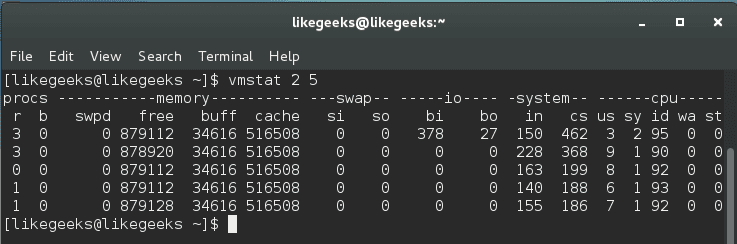
Where 2 is the delay in seconds and 5 is the number of times vmstat is called. It shows five updates of the command and all data is presented in kilobytes.
Page-in (si) happens when you start an application and the information is paged-in. Page out (so) happens when the kernel is freeing up memory.
System Load & top Command
In Linux process management, the top command gives you a list of the running processes and how they are using CPU and memory ; the output is a real-time data.
If you have a dual core system may have the first core at 40 percent and the second core at 70 percent, in this case, the top command may show a combined result of 110 percent, but you will not know the individual values for each core.
$ top -c
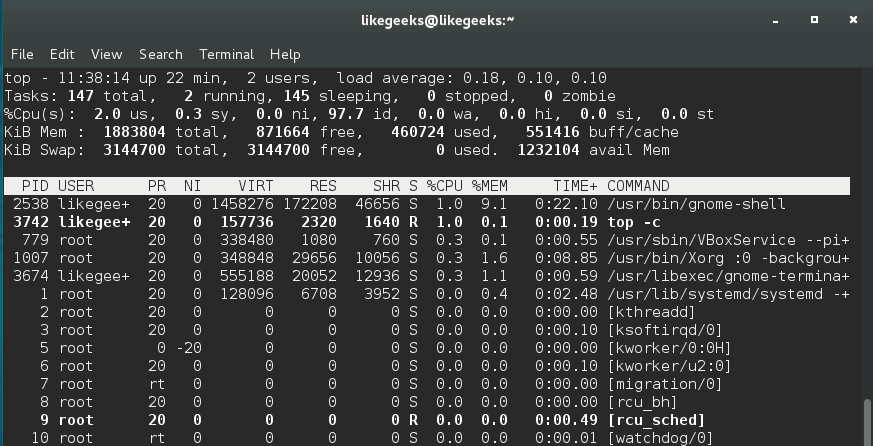
We use -c option to show the command line or the executable path behind that process.
You can press 1 key while you watch the top command statistics to show individual CPU statuses.
Keep in mind that certain processes are spawned like the child processes, you will see multiple processes for the same program like httpd and PHP-fpm.
You shouldn’t rely on top command only, you should review other resources before making a final action.
Monitoring Disk I/O with iotop
The system starts to be slow as a result of high disk activities, so it is important to monitor disk activities. That means figuring out which processes or users cause this disk activity.
The iotop command in Linux process management helps us to monitor disk I/O in real-time. You can install it if you don’t have it:
$ yum install iotop
Running iotop without any options will result in a list all processes.
To view the processes that cause to disk activity, you should use -o option:
$ iotop -o
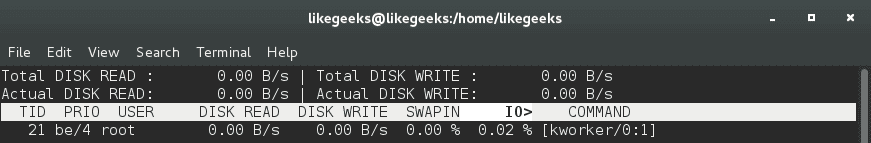
You can easily know what program is impacting the system.
ps command
We’ve talked about ps command before on a previous post and how to order the processes by memory usage and CPU usage.
Monitoring System Health with iostat and lsof
iostat command gives you CPU utilization report; it can be used with -c option to display the CPU utilization report.
$ iostat -c
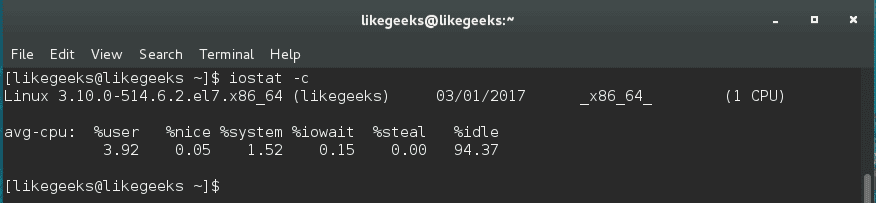
The output result is easy to understand, but if the system is busy, you will see %iowait increases. That means the server is transferring or copying a lot of files.
With this command, you can check the read and write operations, so you should have a solid knowledge of what is hanging your disk and take the right decision.
Additionally, lsof command is used to list the open files:
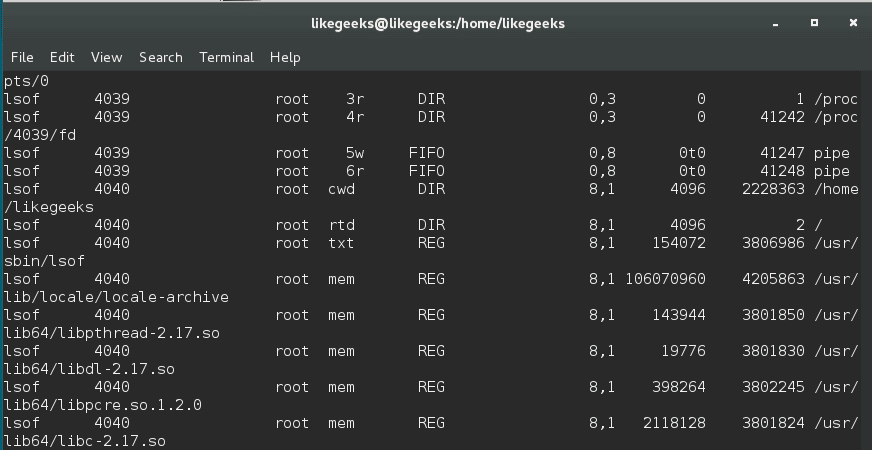
lsof command shows which executable is using the file, the process ID, the user, and the name of the opened file.
Calculating the system load
Calculating system load is very important in Linux process management. The system load is the amount of processing for the system which is currently working. It is not the perfect way to measure system performance, but it gives you some evidence.
The load is calculated like this:
Actual Load = Total Load (uptime) / No. of CPUs
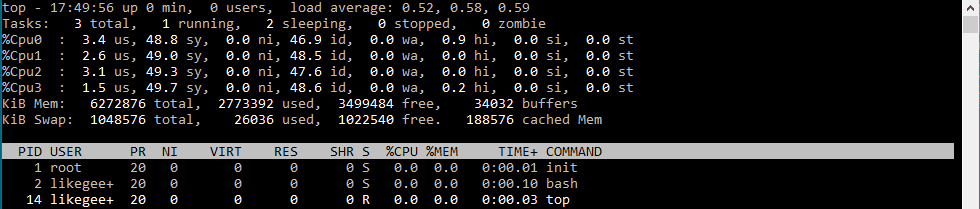
You can calculate the uptime by reviewing uptime command or top command:
$ uptime
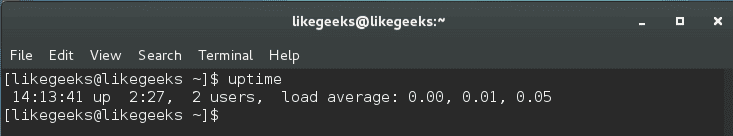
$ top
The server load is shown in 1, 5, and 15 minutes.
As you can see, the average load is 0.00 at the first minute, 0.01 at the fifth minute, and 0.05 at fifteenth minutes.
When the load increases, processors are queued, and if there are many processor cores, the load is distributed equally across the server’s cores to balance the work.
You can say that the good load average is about 1. This does not mean if the load exceeds 1 that there is a problem, but if you begin to see higher numbers for a long time, that means a high load and there is a problem.
pgrep and systemctl
You can get the process ID using pgrep command followed by the service name.
$ pgrep servicename
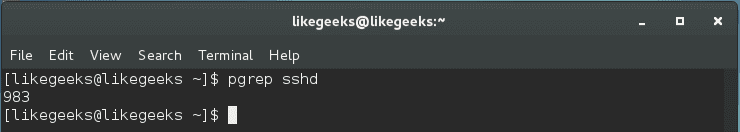
This command shows the process ID or PID.
Note if this command shows more than process ID like httpd or SSH, the smallest process ID is the parent process ID.
On the other hand, you can use the systemctl command to get the main PID like this:
$ systemctl status <service_name>.service
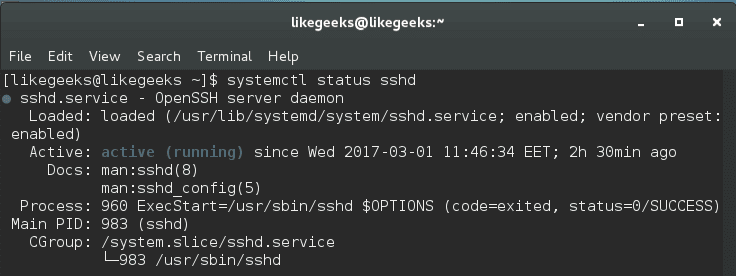
There are more ways to obtain the required process ID or parent process ID, but this one is easy and straight.
Managing Services with systemd
If we are going to talk about Linux process management, we should take a look at systemd. The systemd is responsible for controlling how services are managed on modern Linux systems like CentOS 7.
You can start, stop and check the status like this:
$ systemctl status .service
$ systemctl stop .service
$ systemctl start .service
Instead of using chkconfig command to enable and disable a service during the boot, you can use the systemctl command:
$ systemctl enable .service
$ systemctl disable .service
Systemd also ships with its own version of the top command, and in order to show the processes that are associated with a specific service, you can use the system-cgtop command like this:
$ systemd-cgtop
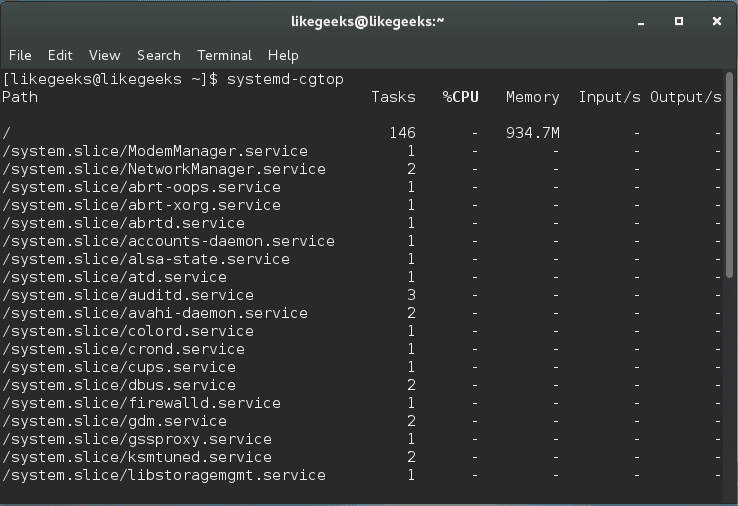
As you can see, all associated processes, path, the number of tasks, the % of CPU used, memory allocation, and the inputs and outputs related.
This command can be used to output a recursive list of service content like this:
$ systemd-cgls

This command gives us very useful information that can be used to make your decision.
Nice and Renice Processes
The process nice value is a numeric indication that belongs to the process and how it’s fighting for the CPU.
A high nice value indicates a low priority for your process, so how nice you are going to be to other users, and from here the name came.
The nice range is from -20 to +19.
nice command sets the nice value for a process at creation time, while renice command adjusts the value later.
$ nice –n 5 ./myscript
This command increases the nice value which means lower priority by 5.
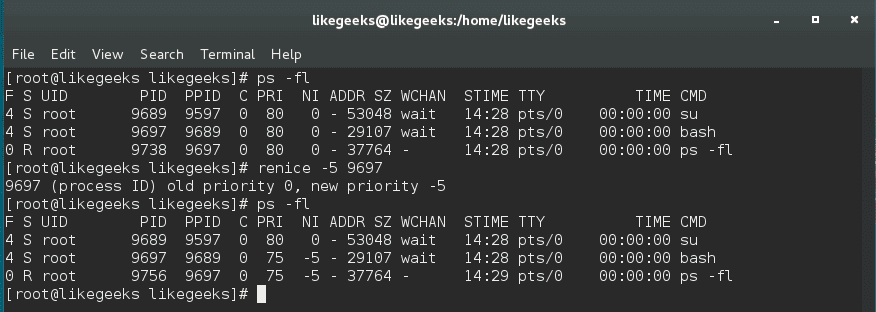
$ sudo renice -5 2213
This command decreases the nice value means increased priority and the number (2213) is the PID.
You can increase its nice value (lower priority) but cannot lower it (high priority) while root user can do both.
Sending the kill signal
To kill a service or application that causes a problem, you can issue a termination signal (SIGTERM). You can review the previous post about signals and jobs.
$ kill process ID
This method is called safe kill. However, depending on your situation, maybe you need to force a service or application to hang up like this:
$ kill -1 process ID
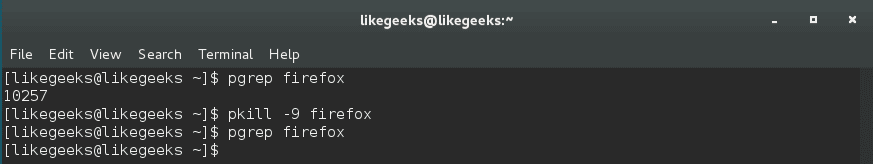
Sometimes the safe killing and reloading fail to do anything, you can send kill signal SIGKILL by using -9 option which is called forced kill.
$ kill -9 process ID
There are no cleanup operations or safe exit with this command and not preferred. However, you can do something more proper by using the pkill command.
$ pkill -9 serviceName
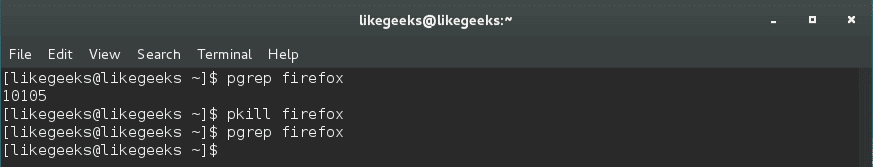
And you can use pgrep command to ensure that all associated processes are killed.
$ pgrep serviceName
I hope you have a good idea about Linux process management and how to make a good action to make the system healthy.
Thank you.
No comments yet.