

Archive | GNU/Linux

Linux Network Commands Used In Network Troubleshooting

In the previous post, we talked about Linux process management. In this post, we will talk about Linux network commands and how to troubleshoot your network. Once you have confirmed that the physical network is working, the next step is to troubleshoot your network and here we come to our topic which is Linux network commands and how to use them to troubleshoot your network. We are going to cover the most used Linux network commands. The ping command is one of the most used Linux network commands in network troubleshooting. It is used to check whether or not a specific IP address can be reached. The ping command works by sending an ICMP echo request to check the network connectivity.

Continue Reading →

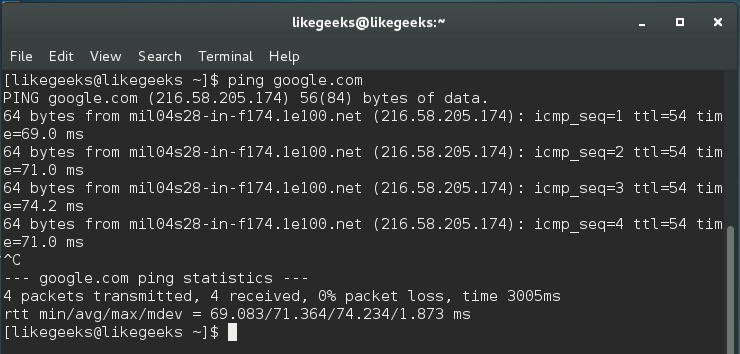
$ ping google.com

ping linux network commands

These results are showing a successful ping, and it can be described as the trip of an echo request issued by our system to google.com.

This command measures the average response. If there is no response, then maybe there is one of the following:

  • There is a physical problem on the network itself.
  • The location might be incorrect or non-functional.
  • The ping request is blocked by the target.
  • There is a problem in the routing table.

If you want to limit the number of echo requests made to 3, you can do it like this:

$ ping -c 3 google.com
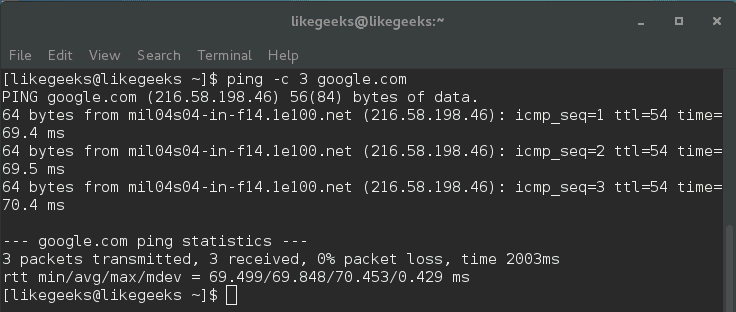
ping -c Linux network commands

Here ping command stops sending echo requests after 3 cycles.

There are some issues that you should consider about ping command. These issues may not necessarily mean that there is a problem like:

Distance to the target: so if you live in the U.S. and you ping a server on Asia, you should expect that this ping will take much time than pinging a server in the U.S.

The connection speed: if your connection is slow, ping will take longer time than if you have a fast connection.

The hop count: this refers to routers and servers that the echo travels across till reaching its destination.

The important rule about ping is that the low ping is always desirable.

Get DNS Records Using dig and host Commands

You can use the dig command to verify DNS mappings, host addresses, MX records, and all other DNS records for a better understanding of DNS topography.

The dig command was developed to replace nslookup command.

$ dig google.com
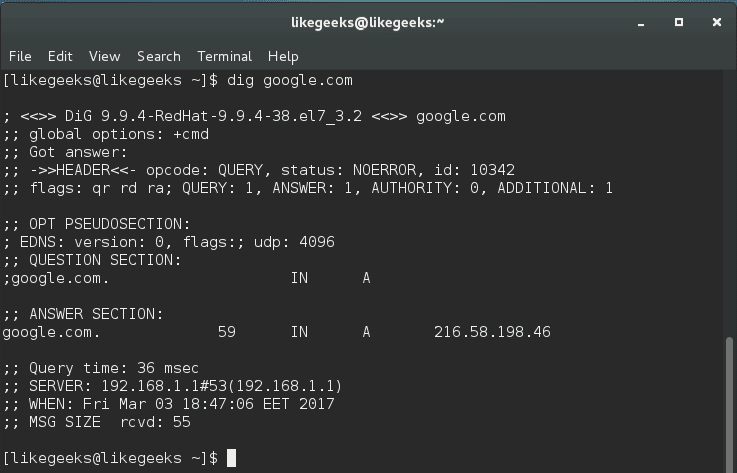
dig linux network commands

The dig command by default searches for A records, you can obtain information for specific record types like MX records or NS records.

$ dig google.com MX
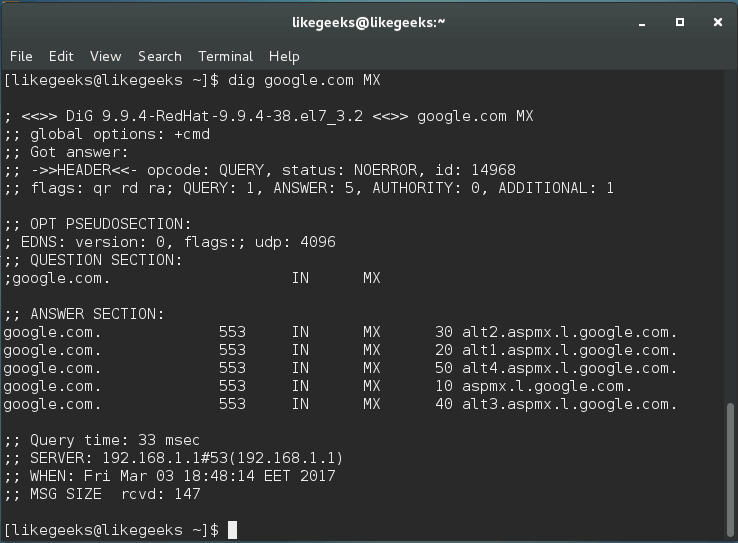
dig mx linux network commands

You can get all types of records by using ANY query.

$ dig google.com ANY
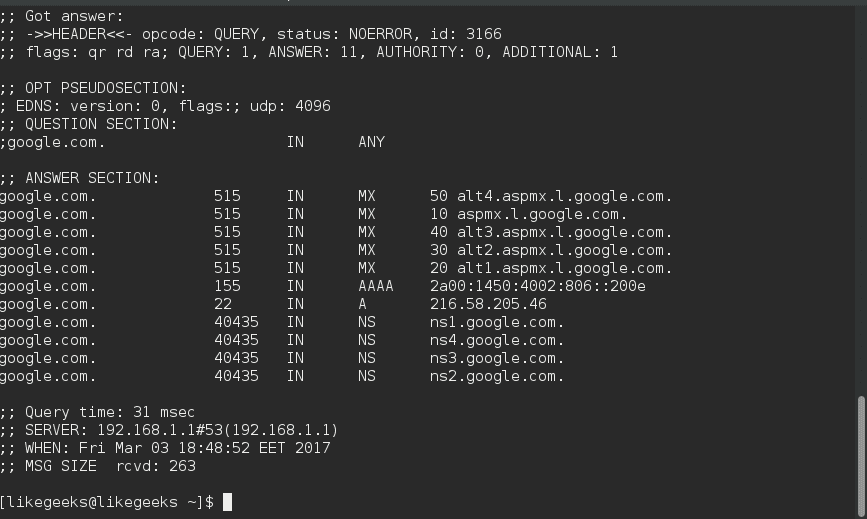
dig ANY linux network commands

The dig command makes a reverse lookup to get DNS information like this:

$ dig –x 8.8.8.8
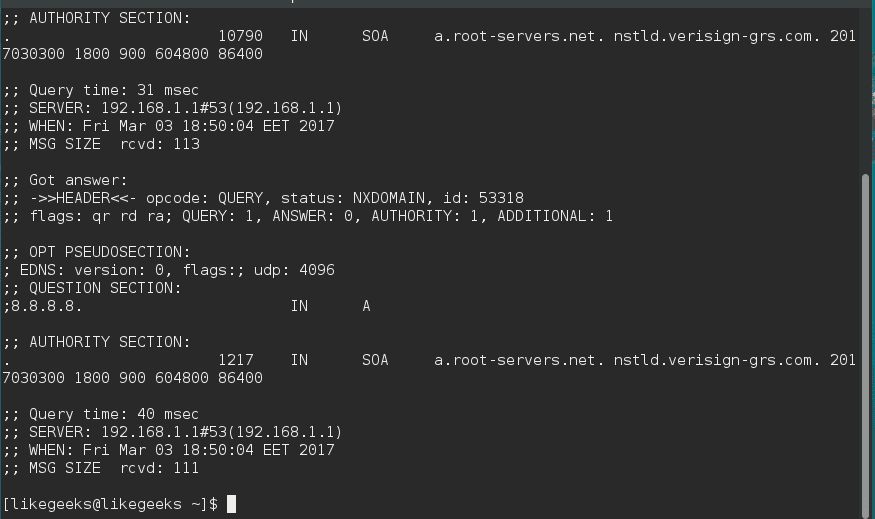
dig -x linux network commands

dig command does its query using the servers listed on /etc/resolv.conf.

The host command is similar to dig command.

$ host –a google.com

host linux network commands

Also, you can perform reverse lookups using host command.

$ host 8.8.8.8

So both commands work in a similar way but dig command provides more advanced options.

Diagnose Network Latency Using traceroute Command

The traceroute command is one of the most useful Linux network commands. It is used to show the pathway to your target and where the delay comes from. This command helps basically in:

  • Providing the names and the identity of every device on the path.
  • Reporting network latency and identify at which device the latency comes from.

$ traceroute google.com
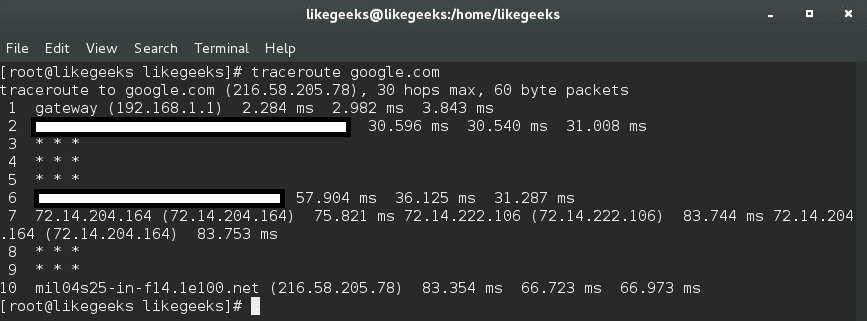
traceroute linux network commands

The output will provide the specified host, the size of the packet that will be used, the IP address, and the maximum number of hops required. You can see the hostname, IP address, the hop number, and packet travel times.

To avoid reverse DNS lookup, use the -n option.

$ traceroute -n google.com
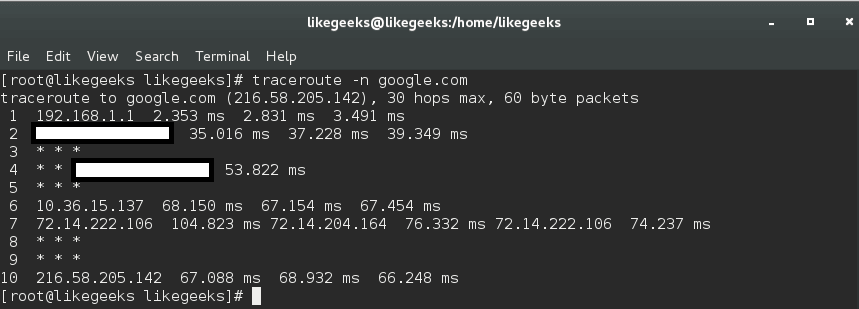
traceroute -n linux network commands

By using traceroute command, you can identify network bottlenecks. The asterisks shown here means there is a potential problem in routing to that host, as the asterisks indicate packet loss or dropped packets.

The traceroute command sends a UDP packet, traceroute can send UDP, TCP, and ICMP.

If you need to send ICMP packet, you can send it like this:

$ sudo traceroute -I google.com
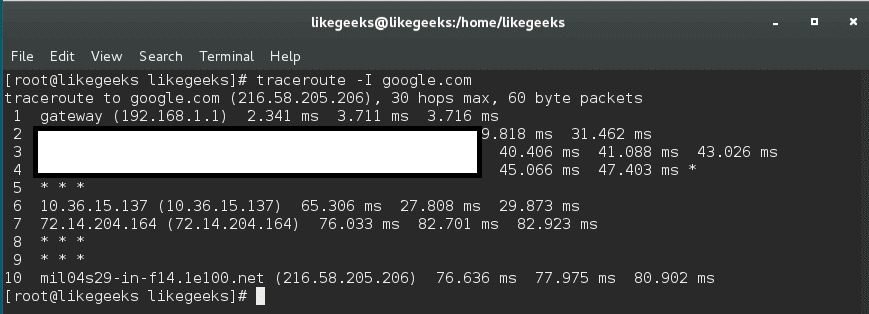
traceroute -I linux network commands

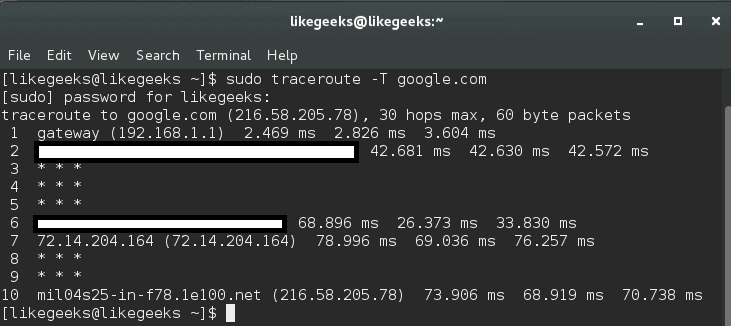
To use a TCP variation, it can be used like this:

$ sudo traceroute -T google.com
traceroute -T linux network commands

This is because some servers block UDP requests, so you can use this method.

In this case, you can send UDP, ICMP, or TCP to bypass these issues.

mtr Command (Realtime Tracing)

This command is an alternative to traceroute command.

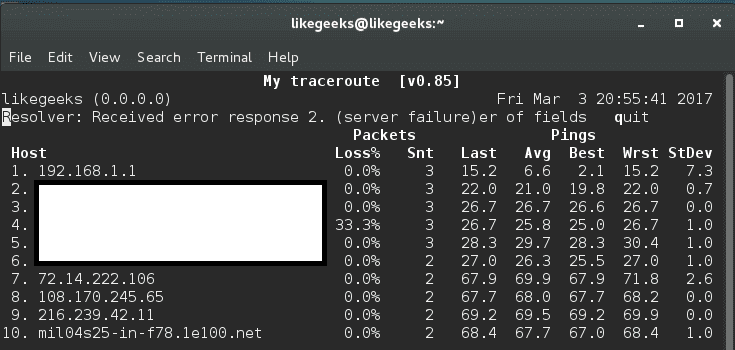
$ mtr google.com
mtr linux network command

The best thing about mtr command is that it displays real-time data unlike traceroute.

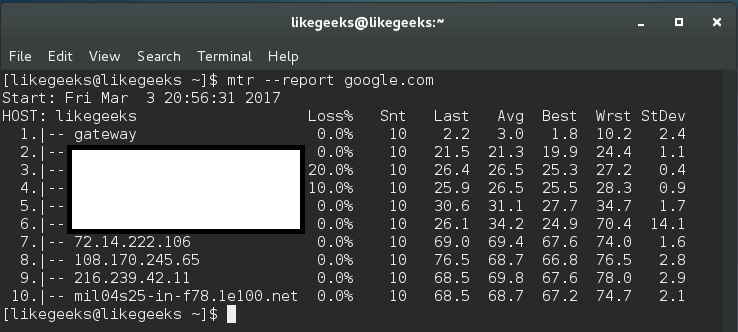
Furthermore, you can use the mtr command with –report option, this command sends 10 packets to each hop found on its way like this:

$ mtr --report google.com
mtr report linux network command

This command gives a huge amount of details better than traceroute.

If this command doesn’t run using a normal user account, you should use root, since some distros adjust the permission of this binary for root users only.

Checking Connection Performance Using ss Command

The socket statistics command ss is a replacement for netstat, it’s faster than netstat and gives more information.

The ss command gets its information directly from the kernel instead of relying on /proc directory like netstat command.

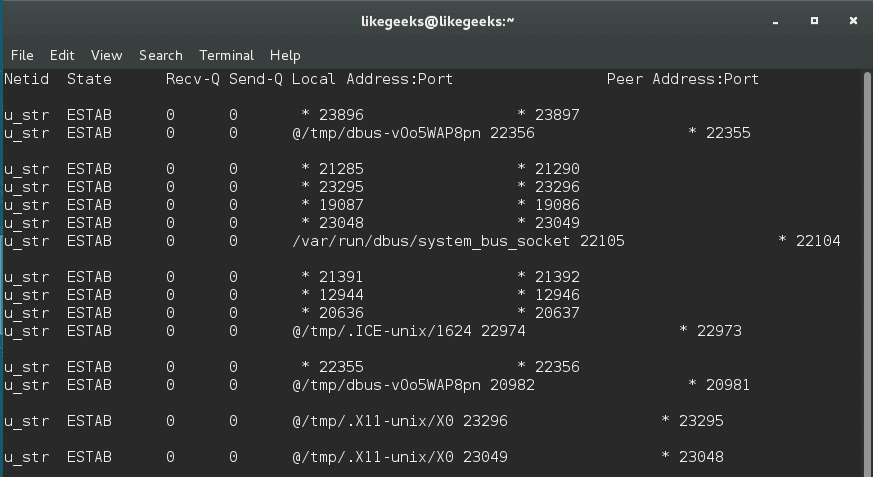
$ ss | less
ss linux network command

This command outputs all TCP, UDP, and UNIX socket connections and pipes the result to the less command for better display.

You can combine this command with either the -t to show TCP sockets or -u to show UDP or -x to show UNIX sockets. And you should use -a option combined with any of these options to show the connected and listening sockets.

$ ss -ta
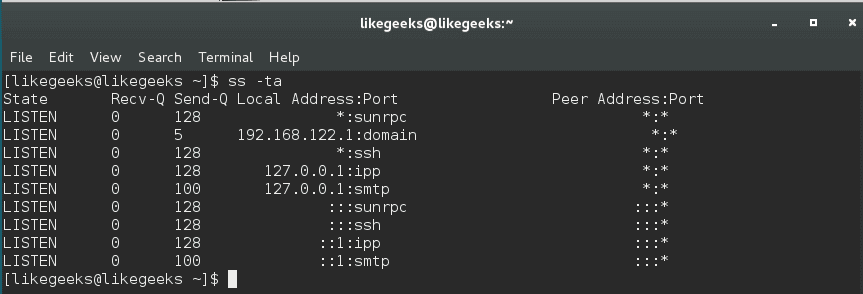
ss -ta linux network command

To list all established TCP sockets for IPV4, use the following command:

$ ss -t4 state established
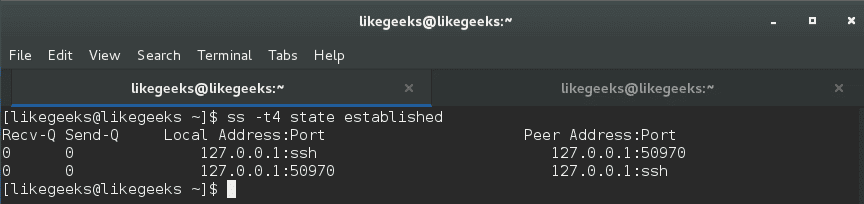
ss established connections

To list all closed TCP states:

$ ss -t4 state closed

You can use the ss command to show all connected ports from a specific IP:

$ ss dst XXX.XXX.XXX.XXX

And you can filter by a specific port like this:

$ ss dst XXX.XXX.XXX.XXX:22

Install and Use iftop Command For Traffic Monitoring

iftop utility or iftop command is used to monitor the traffic and display real-time results.

You can download the tool like this:

$ wget http://www.ex-parrot.com/pdw/iftop/download/iftop-0.17.tar.gz

Then extract it:

$ tar zxvf iftop-0.17.tar.gz

Then compile it:

$ cd iftop-0.17

$ ./configure

$ make

$ make install

If you got any errors about libpcap, you can install it like this:

$ yum install libpcap-dev

And you can run the tool as a root user like this:

$ sudo iftop -I
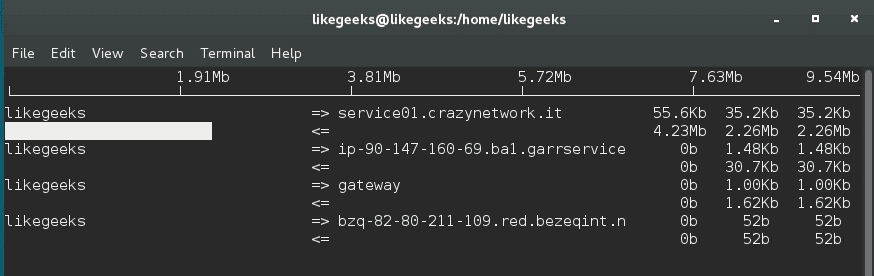
iftop command

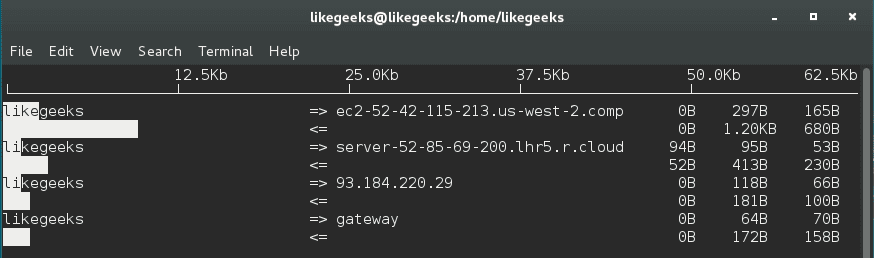
And you will see this table with a real-time data about your traffic.

add –P option with iftop to show ports.

$ sudo iftop -P
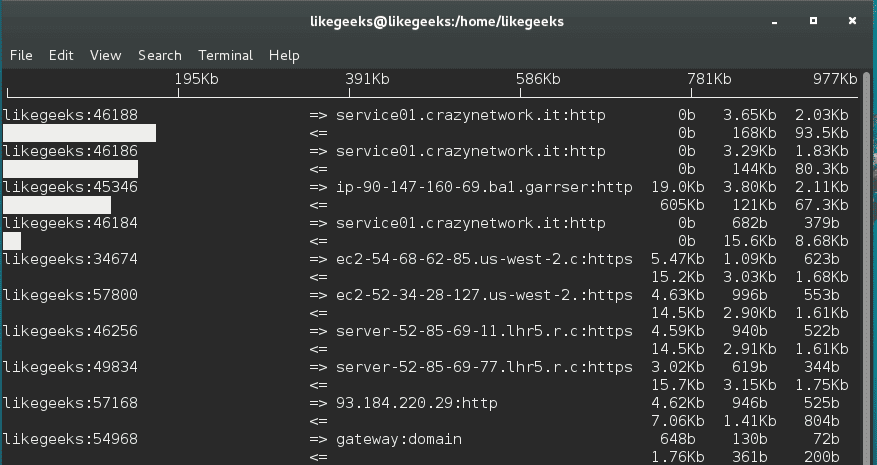
iftop -P linux network commands

You can use the -B option to display the output in bytes instead of bits which is shown by default.

$ iftop -B
iftop -B linux ntwork command

There a lot of options, you can check them man iftop

arp Command

Systems keep a table of IP addresses and their corresponding MAC addresses, this table is called ARP lookup table. If you try to connect to an IP address, your router will check for your MAC address. If it’s cached, ARP table is not used.

To view the arp table, use the arp command:

$ arp

arp linux network command

By default, arp command shows the hostnames, you can show IP addresses instead like this:

$ arp -n

arp -n linux network command

You can delete entries from the arp table like this:

$ arp -d HWADDR

Packet Analysis with tcpdump

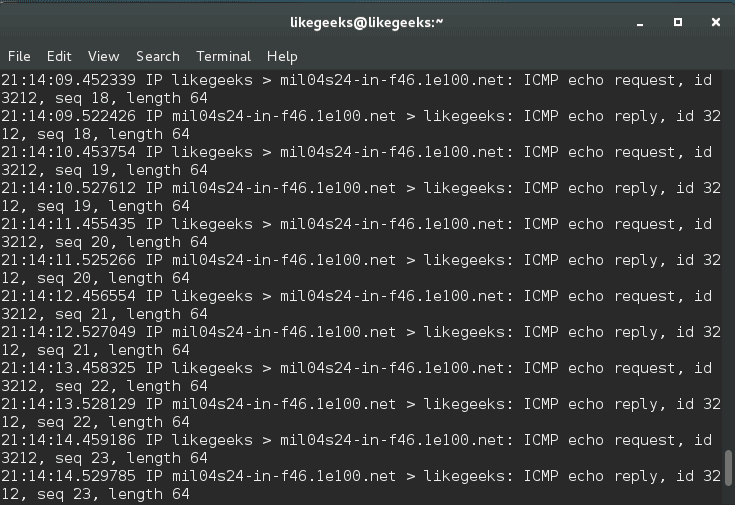
One of the most important Linux network commands is The tcpdump command. tcpdump command is used to capture the traffic that is passing through your network interface.

This kind of access to the packets which is the deepest level of the network can be vital when troubleshooting the network.

$ tcpdump -i <network_device>
tcpdump linux network command

You can also specify a protocol (TCP, UDP, ICMP and others) like this:

$ tcpdump -i tcp

Also, you can specify the port:

$ tcpdump -i port 80

tcpdump will keep running until the request is canceled; it is better to use the -c option in order to capture a pre-determined number of events like this:

$ tcpdump -c 20 -i

You can also specify the IP to capture from using src option or going to using dst option.

$ tcpdump -c 20 -i src XXX.XXX.XXX.XXX

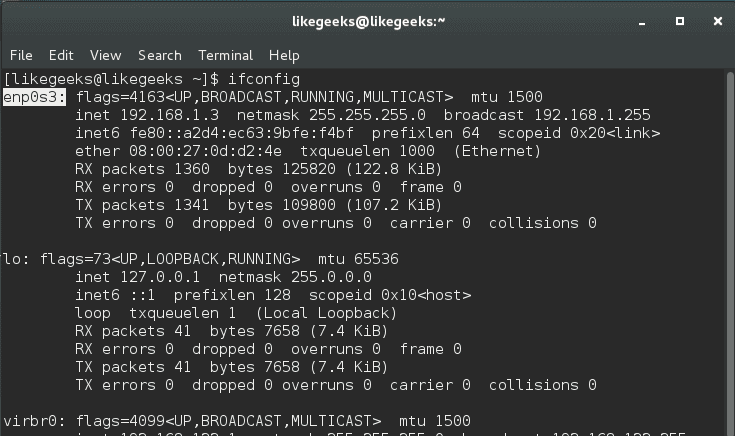
You can obtain the device names like this:

$ ifconfig
ifconfig linux network command

You can save the traffic captured from tcpdump to a file and read it later with -w option.

You can save the traffic captured from tcpdump to a file and read it later with -w option.

$ tcpdump -w /path/ -i

And to read that file:

$ tcpdump -r /path

I hope that Linux network commands we’ve discussed in this post could help you troubleshoot some of your network problems and take the right decision.

Thank you.

likegeeks.com

0

Performance Tuning Using Linux Process Management Commands

In server administration, it is very important to understand how the running processes work in detail, from high load to slow response time processes. When your server becomes so slow or fails to respond, you should understand the process management or Linux process management in specific to an action. When it is the time to kill a process or renice it and how to monitor the currently running processes and how these processes affect the system load. Let’s see how Linux process management will help us tune the system.

Continue Reading →

Process Types

Before we start talking about Linux process management, we should review process types. There are four common types of processes:

  • Parent process
  • Child process
  • Orphan Process
  • Daemon Process
  • Zombie Process

Parent process is a process which runs the fork() system call. All processes except process 0 have one parent process.

Child process is created by a parent process.

Orphan Process it continues running while its parent process has terminated or finished.

Daemon Process is always created from a child process and then exit.

Zombie Process exists in the process table although it is terminated.

The orphan process is a process that still executing and its parent process has died while orphan processes do not become zombie processes.

Memory Management

In server administration, memory management is one of your responsibility that you should care about as a system administrator.

One of most used commands in Linux process management is the free command:

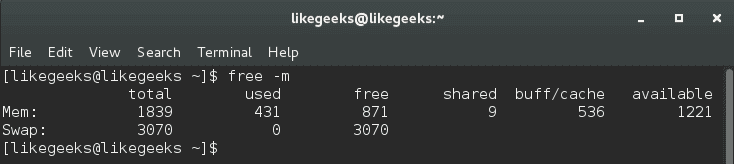
$ free –m

The -m option to show values in megabytes.

linux process managment free command

Our main concern in buff/cache.

The output of free command here means 536 megabytes is used while 1221 megabytes is available.

The second line is the swap. Swapping occurs when memory becomes to be crowded.

The first value is the total swap size which is 3070 megabytes.

The second value is the used swap which is 0.

The third value is the available swap for usage which is 3070.

From the above results, you can say that memory status is good since no swap is used, so while we are talking about the swap, let’s discover what proc directory provides us about the swap.

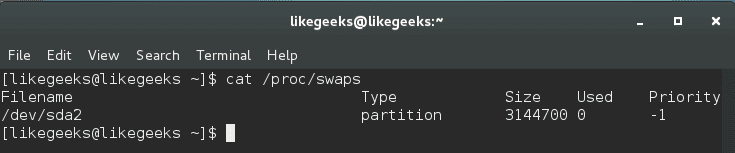
$ cat /proc/swaps

linux process managment swaps

This command shows the swap size and how much is used:

$ cat /proc/sys/vm/swappiness

linux process managment swappiness

This command shows a value from 0 to 100, this value means the system will use the swap if the memory becomes 70% used.

Notice: the default value for most distros for this value is between 30 and 60, you can modify it like this:

$ echo 50 > /proc/sys/vm/swappiness

Or using sysctl command like this:

$ sudo sysctl -w vm.swappiness=50

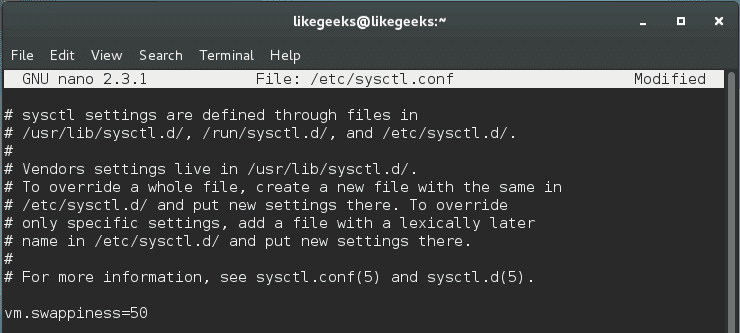
Changing the swappiness value using the above commands is not permanent, you have to write it on /etc/sysctl.conf file like this:

$ nano /etc/sysctl.conf

vm.swappiness=50

linux process managment persist swappiness

Cool!!

The swap level measures the chance to transfer a process from the memory to the swap.

Choosing the accurate swappiness value for your system requires some experimentation to choose the best value for your server.

Managing virtual memory with vmstat

Another important command used in Linux process management which is vmstat. vmstat command gives a summary reporting about memory, processes, and paging.

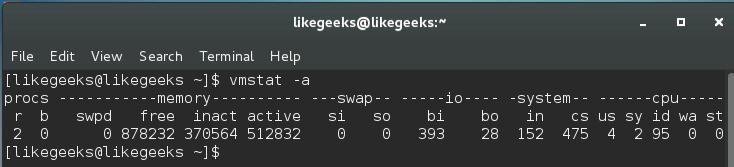
$ vmstat -a

-a option is used to get all active and inactive processes.

linux process managment vmstat command

And this is the important column outputs from this command:

si:                           How much swapped in from disk.

so:                          How much swapped out to disk.

bi:                           How much sent to block devices.

bo:                         How much obtained from block devices.

us:                          The user time.

sy:                          The system time.

id:                           The idle time.

Our main concern is the (si) and (so) columns, where (si) column shows page-ins while (so) column provides page-outs.

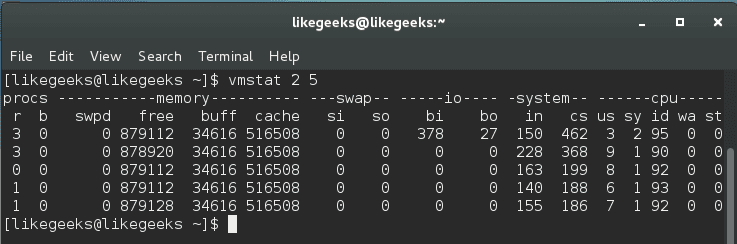
A better way to look at these values is by viewing the output with a delay option like this:

$ vmstat 2 5

linux process managment vmstat delay

Where 2 is the delay in seconds and 5 is the number of times vmstat is called. It shows five updates of the command and all data is presented in kilobytes.

Page-in (si) happens when you start an application and the information is paged-in. Page out (so) happens when the kernel is freeing up memory.

System Load & top Command

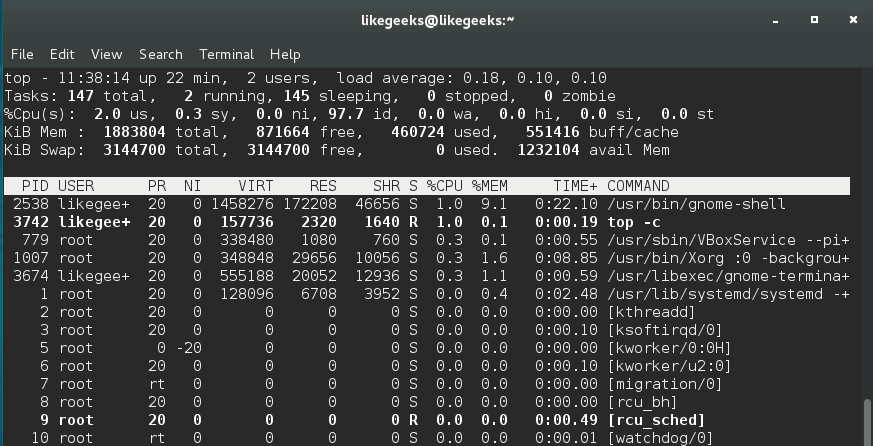
In Linux process management, the top command gives you a list of the running processes and how they are using CPU and memory ; the output is a real-time data.

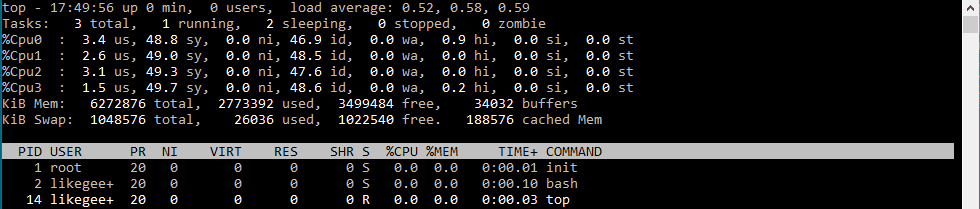
If you have a dual core system may have the first core at 40 percent and the second core at 70 percent, in this case, the top command may show a combined result of 110 percent, but you will not know the individual values for each core.

$ top -c

linux process managment top command

We use -c option to show the command line or the executable path behind that process.

You can press 1 key while you watch the top command statistics to show individual CPU statuses.

linux process management individual cpu status

Keep in mind that certain processes are spawned like the child processes, you will see multiple processes for the same program like httpd and PHP-fpm.

You shouldn’t rely on top command only, you should review other resources before making a final action.

Monitoring Disk I/O with iotop

The system starts to be slow as a result of high disk activities, so it is important to monitor disk activities. That means figuring out which processes or users cause this disk activity.

The iotop command in Linux process management helps us to monitor disk I/O in real-time. You can install it if you don’t have it:

$ yum install iotop

Running iotop without any options will result in a list all processes.

To view the processes that cause to disk activity, you should use -o option:

$ iotop -o

linux process managment iotop command

You can easily know what program is impacting the system.

ps command

We’ve talked about ps command before on a previous post and how to order the processes by memory usage and CPU usage.

Monitoring System Health with iostat and lsof

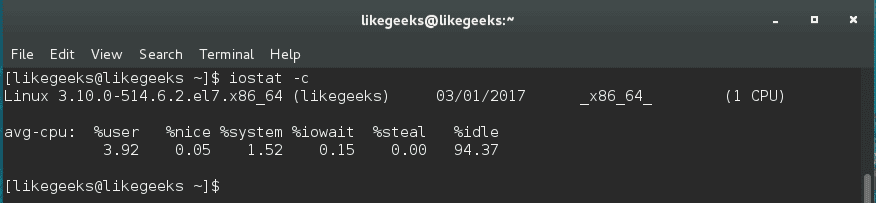
iostat command gives you CPU utilization report; it can be used with -c option to display the CPU utilization report.

$ iostat -c

linux process managment iostat command

The output result is easy to understand, but if the system is busy, you will see %iowait increases. That means the server is transferring or copying a lot of files.

With this command, you can check the read and write operations, so you should have a solid knowledge of what is hanging your disk and take the right decision.

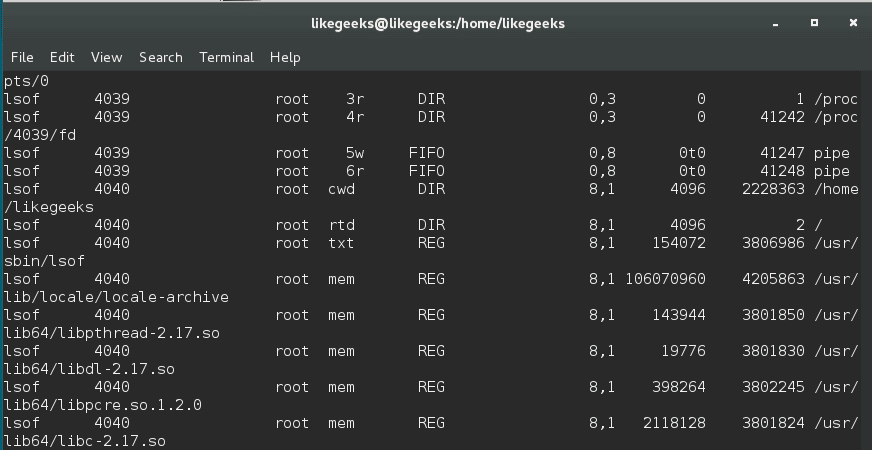
Additionally, lsof command is used to list the open files:

linux process managment lsof command

lsof command shows which executable is using the file, the process ID, the user, and the name of the opened file.

Calculating the system load

Calculating system load is very important in Linux process management. The system load is the amount of processing for the system which is currently working. It is not the perfect way to measure system performance, but it gives you some evidence.

The load is calculated like this:

Actual Load = Total Load (uptime) / No. of CPUs

You can calculate the uptime by reviewing uptime command or top command:

$ uptime

linux process managment uptime command

$ top

The server load is shown in 1, 5, and 15 minutes.

As you can see, the average load is 0.00 at the first minute, 0.01 at the fifth minute, and 0.05 at fifteenth minutes.

When the load increases, processors are queued, and if there are many processor cores, the load is distributed equally across the server’s cores to balance the work.

You can say that the good load average is about 1. This does not mean if the load exceeds 1 that there is a problem, but if you begin to see higher numbers for a long time, that means a high load and there is a problem.

pgrep and systemctl

You can get the process ID using pgrep command followed by the service name.

$ pgrep servicename

linux process managment pgrep command

This command shows the process ID or PID.

Note if this command shows more than process ID like httpd or SSH, the smallest process ID is the parent process ID.

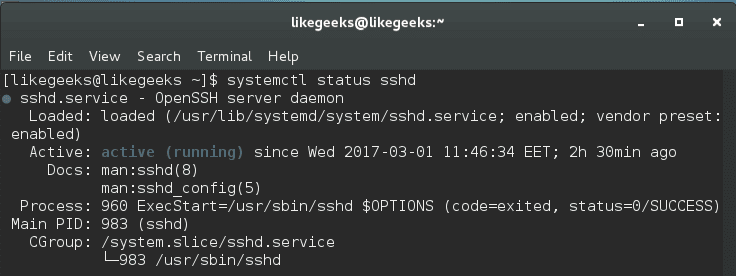
On the other hand, you can use the systemctl command to get the main PID like this:

$ systemctl status <service_name>.service

linux process managment systemctl command

There are more ways to obtain the required process ID or parent process ID, but this one is easy and straight.

Managing Services with systemd

If we are going to talk about Linux process management, we should take a look at systemd. The systemd is responsible for controlling how services are managed on modern Linux systems like CentOS 7.

You can start, stop and check the status like this:

$ systemctl status .service

$ systemctl stop .service

$ systemctl start .service

Instead of using chkconfig command to enable and disable a service during the boot, you can use the systemctl command:

$ systemctl enable .service

$ systemctl disable .service

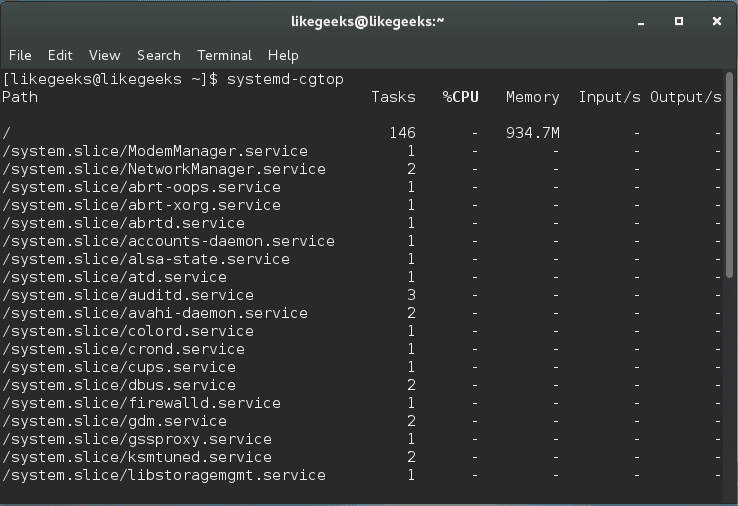
Systemd also ships with its own version of the top command, and in order to show the processes that are associated with a specific service, you can use the system-cgtop command like this:

$ systemd-cgtop

linux process managment systemd-cgtop

As you can see, all associated processes, path, the number of tasks, the % of CPU used, memory allocation, and the inputs and outputs related.

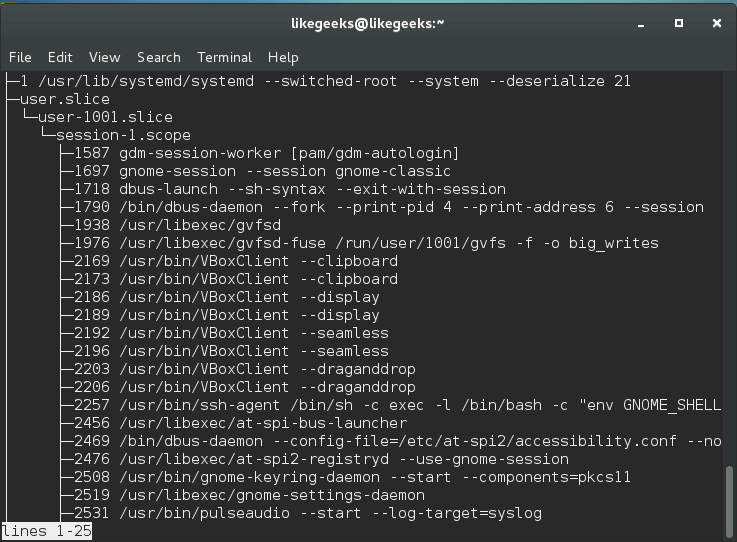
This command can be used to output a recursive list of service content like this:

$ systemd-cgls

linux process managment systemd-cgls

This command gives us very useful information that can be used to make your decision.

Nice and Renice Processes

The process nice value is a numeric indication that belongs to the process and how it’s fighting for the CPU.

A high nice value indicates a low priority for your process, so how nice you are going to be to other users, and from here the name came.

The nice range is from -20 to +19.

nice command sets the nice value for a process at creation time, while renice command adjusts the value later.

$ nice –n 5 ./myscript

This command increases the nice value which means lower priority by 5.

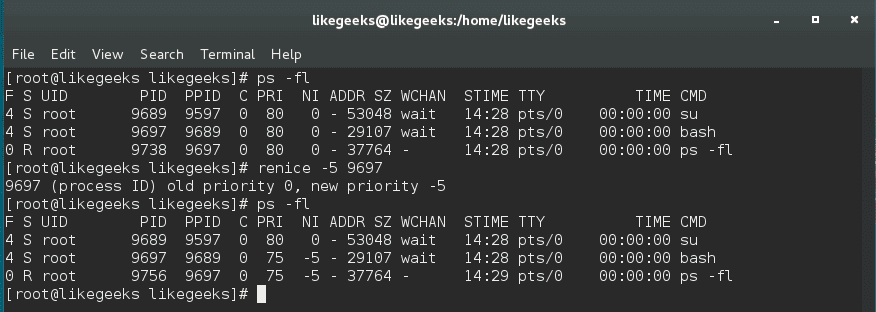
$ sudo renice -5 2213

This command decreases the nice value means increased priority and the number (2213) is the PID.

linux process managment renice command

You can increase its nice value (lower priority) but cannot lower it (high priority) while root user can do both.

Sending the kill signal

To kill a service or application that causes a problem, you can issue a termination signal (SIGTERM). You can review the previous post about signals and jobs.

$ kill process ID

This method is called safe kill. However, depending on your situation, maybe you need to force a service or application to hang up like this:

$ kill -1 process ID

Sometimes the safe killing and reloading fail to do anything, you can send kill signal SIGKILL by using -9 option which is called forced kill.

$ kill -9 process ID

There are no cleanup operations or safe exit with this command and not preferred. However, you can do something more proper by using the pkill command.

$ pkill -9 serviceName

linux process managment pkill command

And you can use pgrep command to ensure that all associated processes are killed.

$ pgrep serviceName

linux process managment pkill -9

I hope you have a good idea about Linux process management and how to make a good action to make the system healthy.

Thank you.

likegeeks.com

0

Raspberry Digital Signage 10.0 duyuruldu

Raspberry Pi üzerinde tasarlanmış bir işletim sistemi olan Raspberry Digital Signage‘in (RDS) 10.0 sürümü duyuruldu. Web sayfalarını, internet üzerinden, yerel ağdan veya dahili (SD-kart içeren) kaynaklardan veren sistem; belirli bir (web) kaynağından tam ekran bir tarayıcı görüntüsü görüntülüyor. Debian “Stretch” tabanlı Raspbian‘a dayalı olarak gelen yeni sürüm; geliştirilmiş HTML5 yetenekleri, Adobe Flash desteği ve H264 / AVC video hızlandırma özelliği ve en iyi Chromium kurulumu ile geliyor. Sistem; varsayılan olarak bir WordPress kurulumu ile geliyor. SSH ve VNC uzaktan yönetim sistemleri de bulunan sistem; HTML5 videoları pürüzsüz oynatabiliyor. Sistem; bazı iyileştirmeler ve kod ile hata düzeltmeleri içeriyor. Raspberry Digital Signage 10.0 hakkında ayrıntılı bilgi edinmek için sürüm duyurusunu inceleyebilirsiniz.

Continue Reading →

Raspberry Digital Signage 10.0 edinmek için aşağıdaki linkten yararlanabilirsiniz.

0